
Most brands vet influencers on follower count and gut feel — then wonder why partnerships underperform. This guide shows you how to use public signals to identify authentic creators, spot fake engagement, and predict ROI before committing a dollar.
Before you can spot a fake influencer, you need to know what real looks like. Engagement rate is the starting point for every vetting decision — and the thresholds change significantly by audience size.
The core formula: Engagement rate = (total engagements / total followers) × 100. Measure across at least 10 recent posts for reliability.
| Follower Count | Healthy Engagement Rate | Red Flag Zone |
|---|---|---|
| 1K – 10K (Nano) | 3% – 10% | Below 1.5% |
| 10K – 100K (Micro) | 1% – 5% | Below 0.5% |
| 100K – 1M (Macro) | 0.5% – 2% | Below 0.2% |
| 1M+ (Mega) | 0.1% – 1% | Below 0.05% |
💡 Key insight: Engagement rate naturally decreases as follower count grows — larger audiences are harder to engage. A micro-influencer at 1.5% engagement is performing well. A mega-influencer at 1.5% may have purchased followers. Always benchmark against their tier.
These five patterns reliably identify influencers with fake followers, purchased engagement, or audiences that won't convert — before you commit budget.
The fastest red flag to spot. Calculate engagement rate across 10 recent posts and compare against the benchmarks above. Disproportionately low engagement for their size means followers are likely fake or disengaged.
Authentic creators have consistent engagement patterns. High-effort content (original research, personal stories, video) should clearly outperform low-effort posts. Random or unexplainable spikes signal artificial engagement.
Authentic follower growth is steady — typically 1–3% per month for established creators. A sudden jump from 100 to 1,000 new followers/month with no viral post or major PR event strongly suggests purchased followers.
Real engagement means thoughtful, relevant comments. Fake engagement shows up as generic one-word responses ("Great!" "🔥🔥🔥"), emojis, or completely off-topic replies from accounts with no profile pictures.
Even if a creator has authentic engagement, if their audience is the wrong audience, the partnership will underperform. A creator with 50K engaged followers in a completely different industry than yours is worthless for your brand.
These are the markers of a creator whose audience is real, engaged, and likely to take action when they endorse your brand.
Authentic creators attract thoughtful audiences. Look for multi-sentence comments, genuine debate, follow-up questions, and replies from real professionals with visible credentials. Comments from identified practitioners are the highest-quality signal.
Authentic engagement is predictable. High-effort content (video, original research, personal stories) reliably outperforms lower-effort posts by 2–3×. Variance should stay within about 20% week-to-week. Predictability = authenticity.
For established creators (10K+), expect 1–3% monthly growth. Growth should accelerate during high-engagement periods and correlate with content quality or PR events. A smooth growth curve with no suspicious spikes is a strong authenticity marker.
Creators with authentic personal brands are consistent. They cover topics aligned with their expertise, have a recognizable perspective, and have been publishing consistently for 2+ years. Longevity and depth signal real credibility.
The single most important positive signal. Verify that their followers and commenters actually work in your target industry, match your customer profile geographically, and are at the right seniority level to buy or influence purchases.
Use this checklist before committing budget to any creator partnership. Each phase has a pass/fail verdict. If you fail Phase 1, stop — don't proceed to Phase 2.
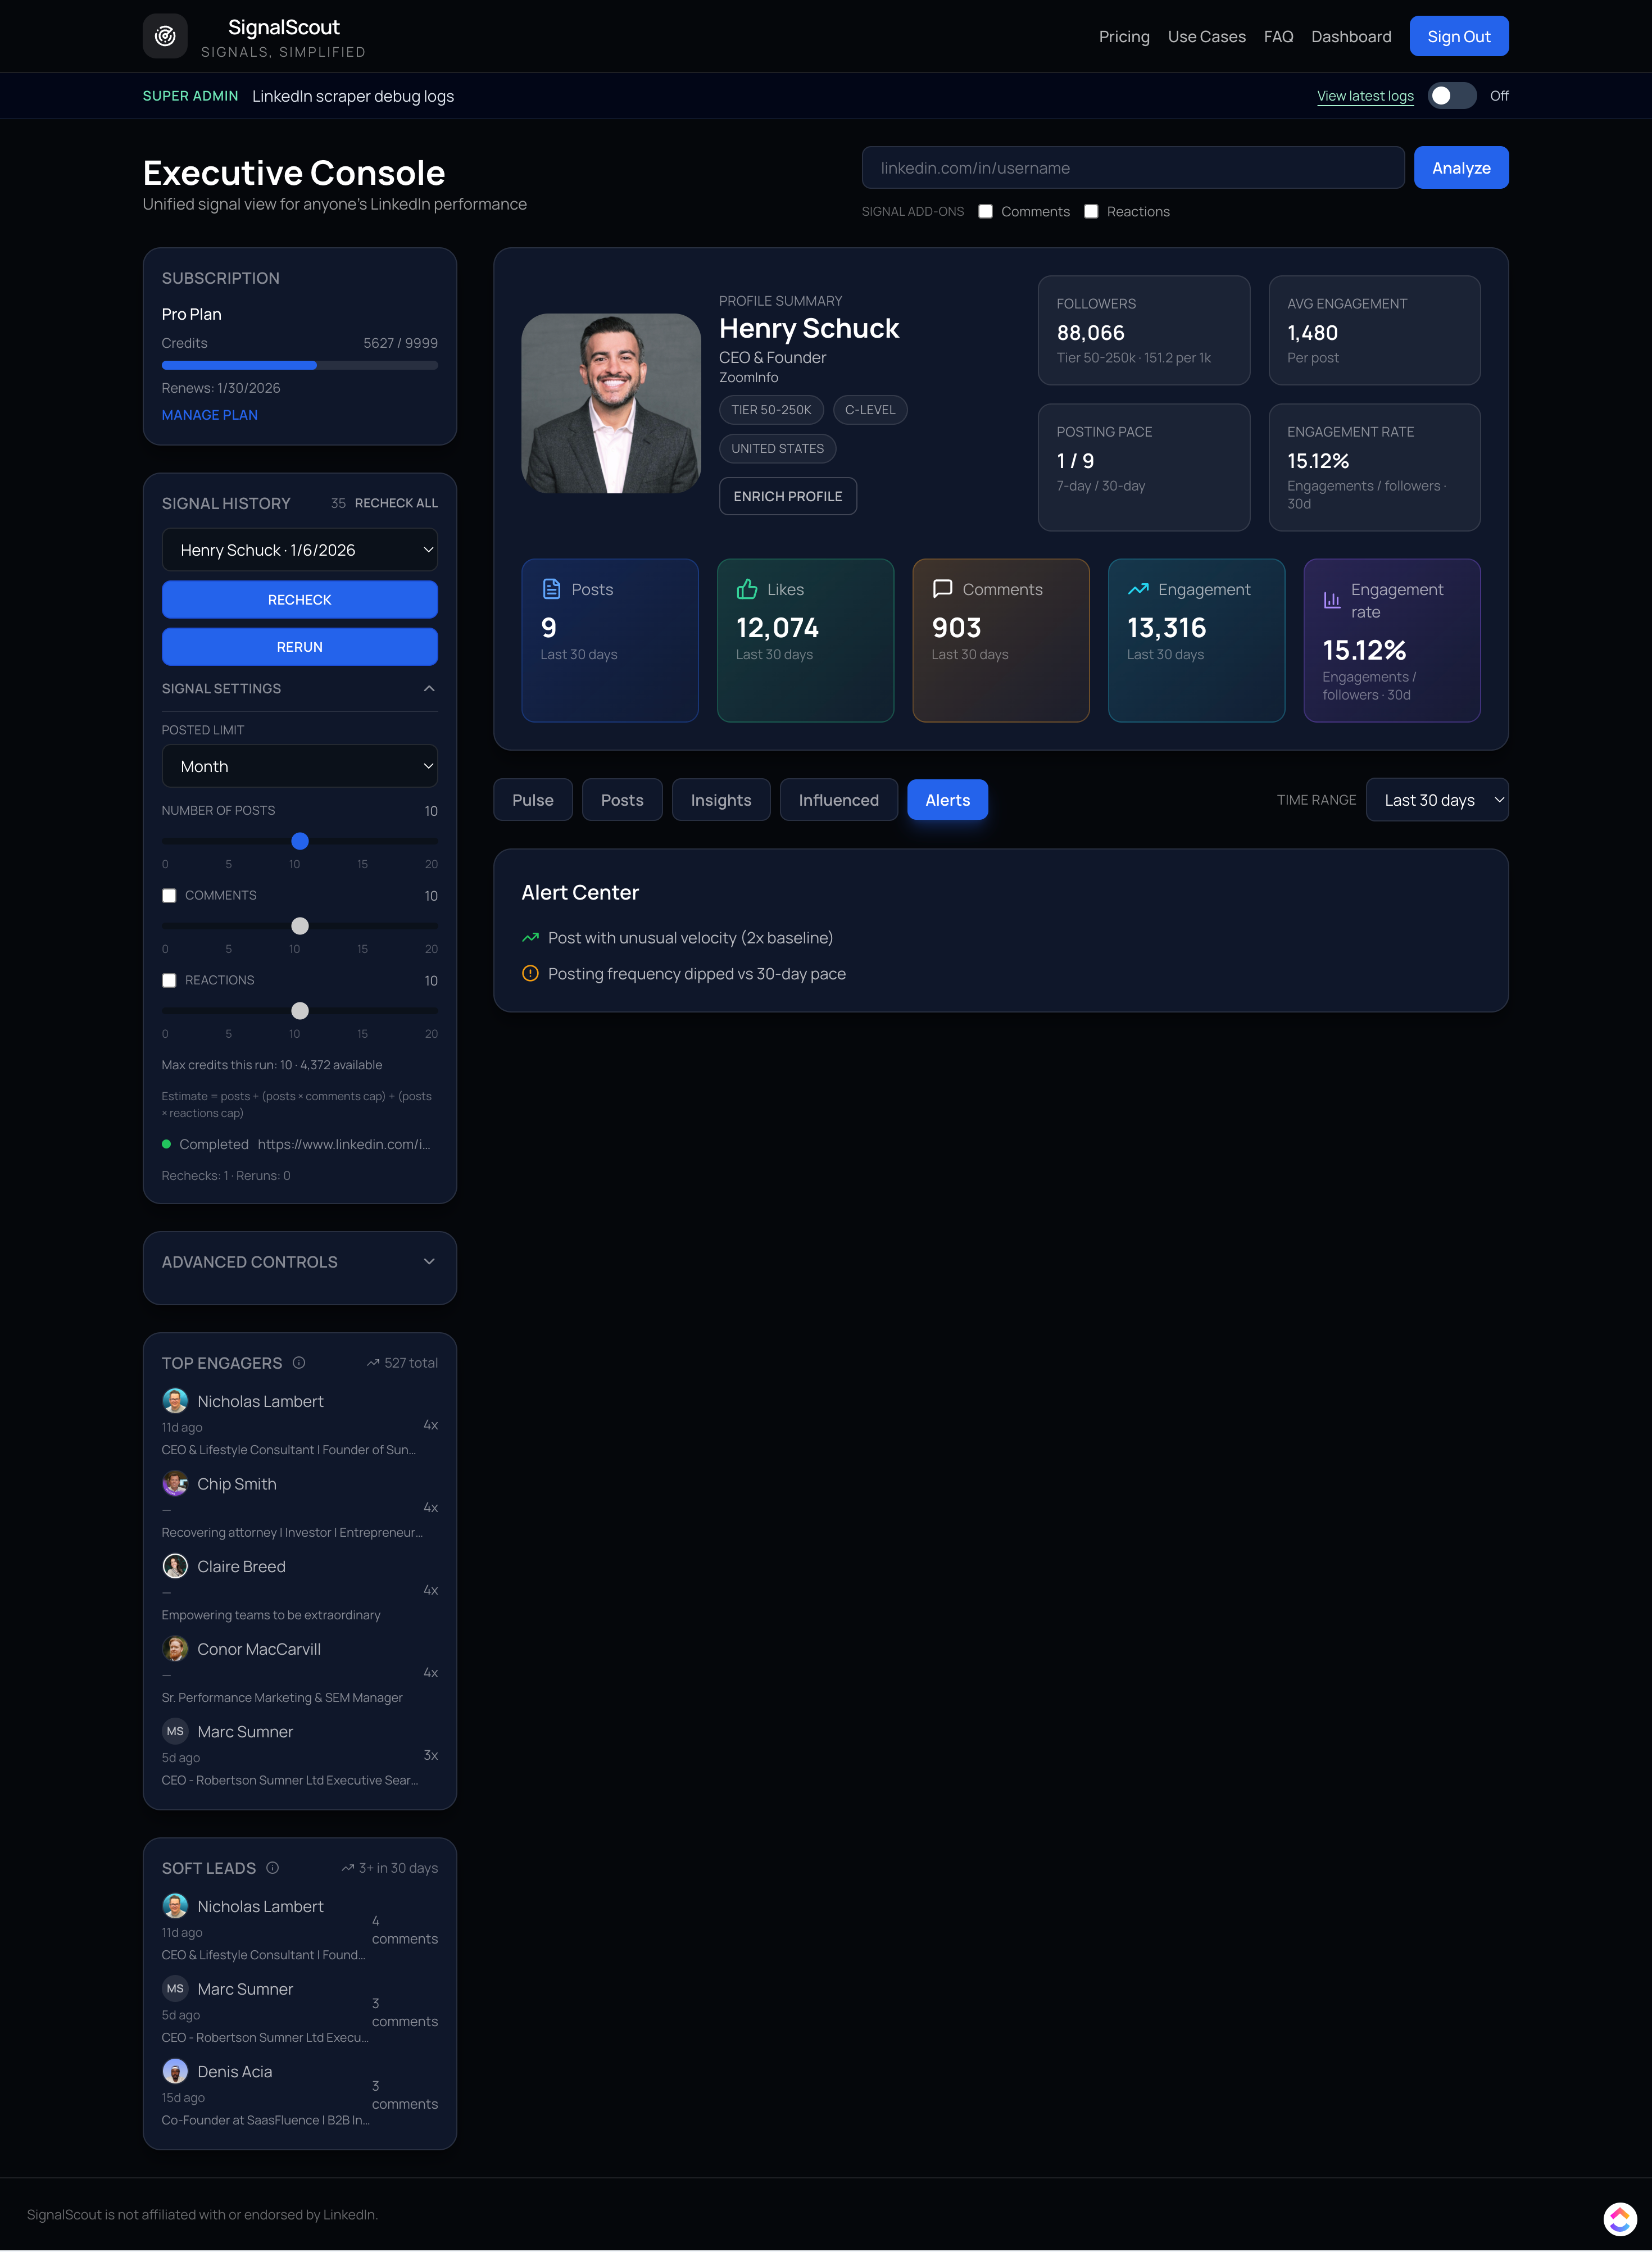
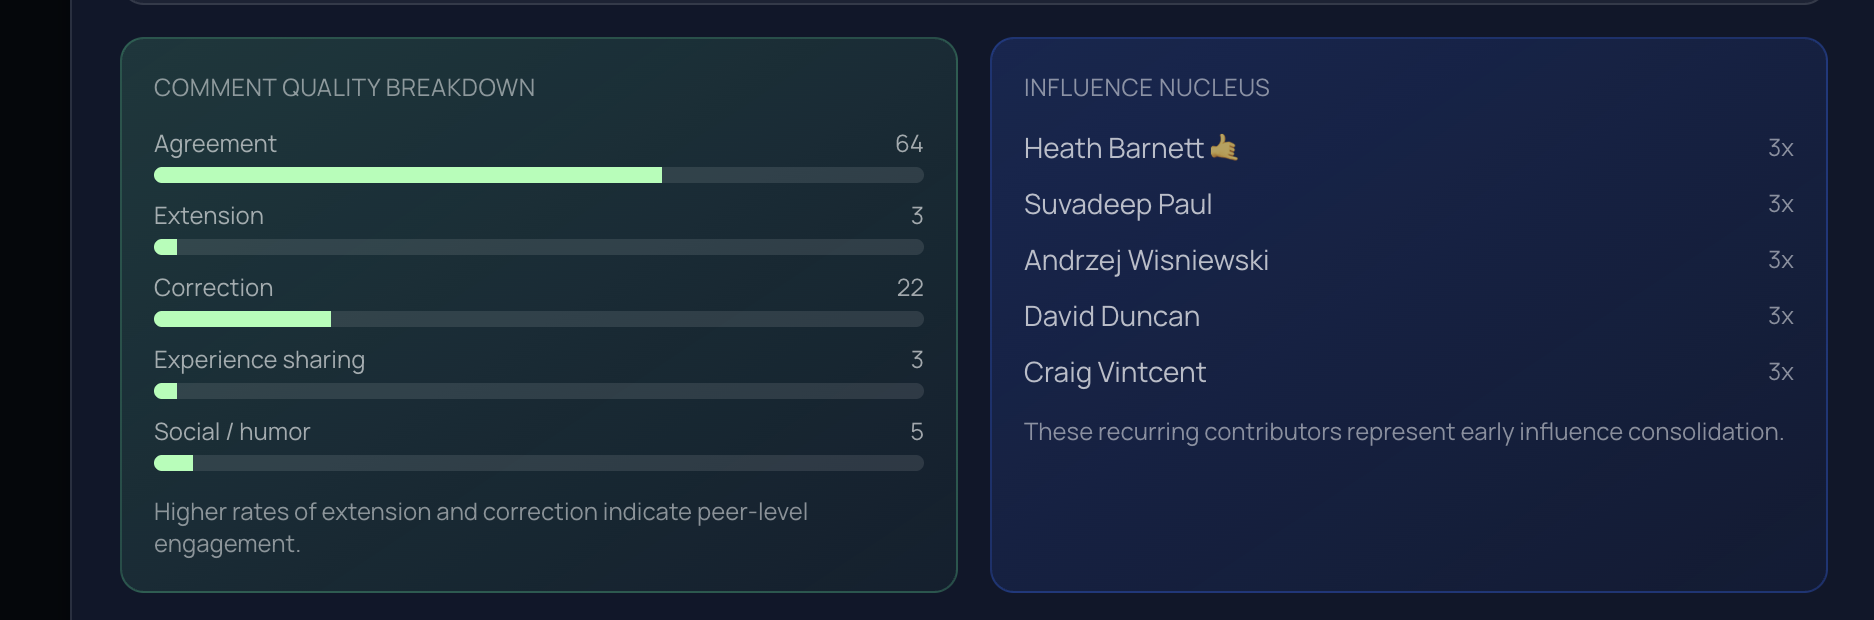
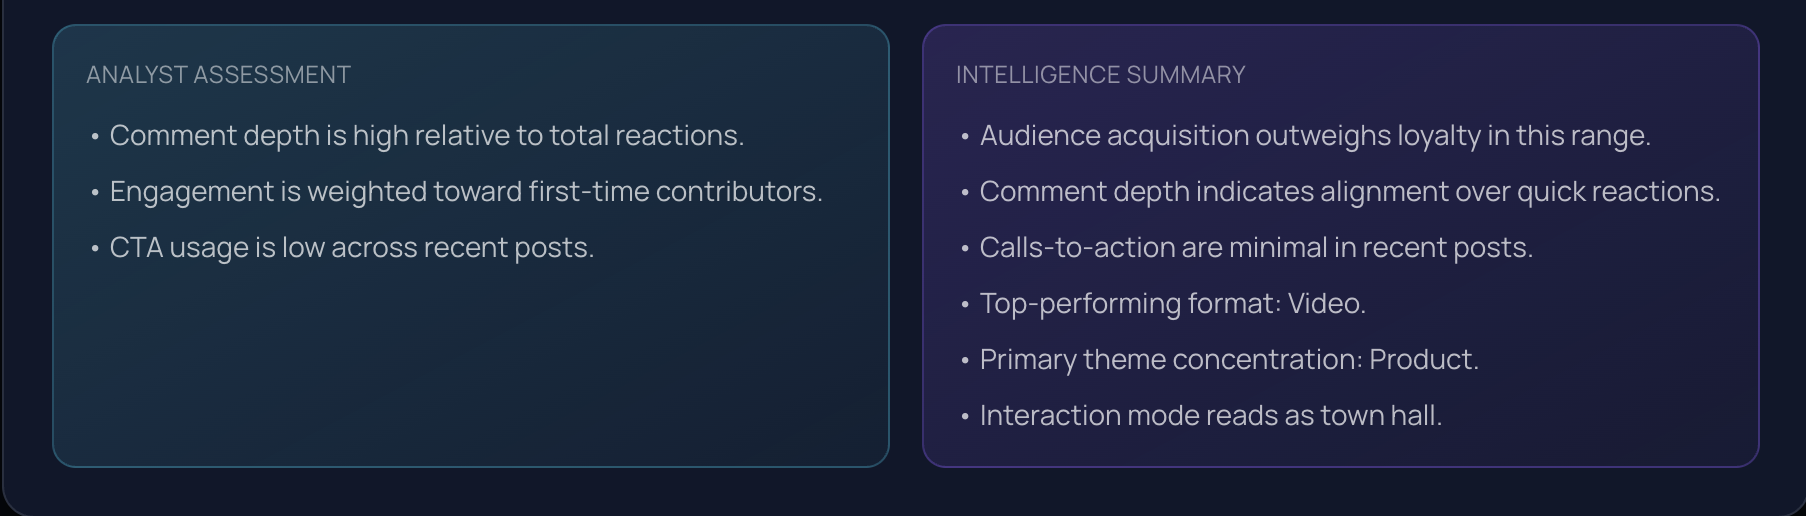
SignalScout surfaces exactly who's engaging with a creator's content — and whether those engagers match your target audience. Here's the Influenced Audience view alongside the comment quality and analyst assessment layers.
Healthy benchmarks vary by follower size. Nano-influencers (1K–10K followers) should achieve 3–10%. Micro-influencers (10K–100K) should hit 1–5%. Macro-influencers (100K–1M) are healthy at 0.5–2%. Mega-influencers (1M+) can be as low as 0.1–1% and still be authentic. If an influencer's rate is significantly below these benchmarks for their tier, it strongly indicates fake or disengaged followers.
The five most reliable red flags are: (1) engagement rate that's disproportionately low for their follower count tier; (2) engagement spikes that don't correlate with content quality — a mediocre post performing the same as their best content; (3) sudden, unexplained follower growth spikes with no correlated viral post or PR event; (4) shallow, generic comments ("Great post!" "🔥") rather than substantive discussion; and (5) audience demographics that don't match your target customer when you spot-check their commenters and followers.
Yes — in almost every case. A creator with 10K followers at 5% engagement (500 engagements per post) will outperform one with 100K followers at 0.3% engagement (300 engagements per post) in terms of actual click-through rates, conversion, and revenue impact. Smaller, highly engaged audiences trust the creator more deeply, act on recommendations more reliably, and generate higher-quality referrals. Don't confuse reach with influence.
Audience demographic fit is the single most important criterion. An authentic creator with deep engagement but the wrong audience will reliably underperform — their followers won't convert because they're not your customer. Always verify that their audience actually matches your target customer profile before evaluating any other metric. You can verify this by clicking through 30 random commenters and checking their industry, role, and company context.
The complete 5-phase manual vetting process takes approximately 30–45 minutes per creator. Initial screening is 5 minutes, audience quality assessment is 15 minutes, engagement quality is 10 minutes, brand fit is 10 minutes, and ROI estimation is 5 minutes. For teams vetting many creators, signal intelligence tools like SignalScout can compress this to under 5 minutes by automating the data extraction and metric calculation steps.